Datoteka:Demographic change in Sweden 1735-2000.png
Prijeđi na navigaciju
Prijeđi na pretragu
Veća rezolucija nije dostupna.
Demographic_change_in_Sweden_1735-2000.png (652 × 415 piksela, veličina datoteke/fajla: 7 kB, MIME tip: image/png)

|
This graph image could be re-created using vector graphics as an SVG file. This has several advantages; see Commons:Media for cleanup for more information. If an SVG form of this image is available, please upload it and afterwards replace this template with
{{vector version available|new image name}}.
It is recommended to name the SVG file “Demographic change in Sweden 1735-2000.svg”—then the template Vector version available (or Vva) does not need the new image name parameter. |
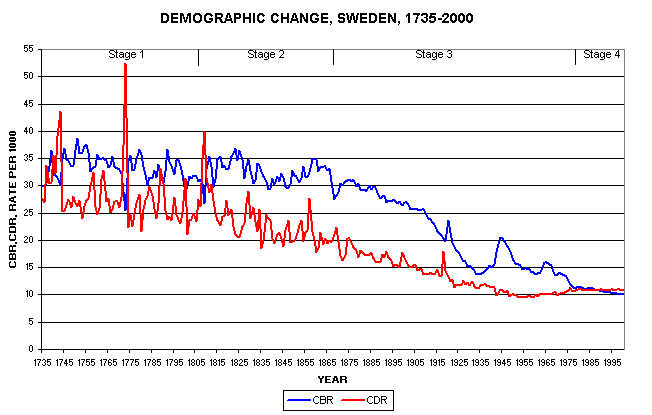
Graph showing demographic change in Sweden over the time period. A good example of a en:Demographic transition.
Taken with permission from [1]
Ova datoteka je licencirana pod Creative Commons Attribution 2.5 generičkom licencom.
- Slobodno smijete:
- dijeliti – umnožavati, raspodjeljivati i prenositi djelo
- prerađivati – prilagođavati djelo
- Pod sljedećim uslovima:
- pripisivanje – Morate pripisati odgovarajuće autorske zasluge, osigurati link ka licenci i naznačiti jesu li napravljene izmjene. To možete uraditi na bilo koji razumni način, ali ne tako da se sugerira da davalac licence odobrava Vas ili Vašu upotrebu njegovog djela.
Izvorna evidencija postavljanja
| Datum/vrijeme | Dimenzije | Korisnik | Komentar |
|---|---|---|---|
| 14. juli 2005., 09:13:33 | 652 × 415 (9835 bytes) | Komencanto (razgovor · doprinos) | Graph showing demographic change in Sweden over the time period. A good example of a [[en:Demographic transition]]. Taken with permission from [http://www.uwmc.uwc.edu/geography/Demotrans/demtran.htm] {{cc-by-2.5}} |
Historija datoteke
Kliknite na datum/vrijeme da biste vidjeli tadašnju verziju datoteke.
| Datum/vrijeme | Minijatura | Dimenzije | Korisnik | Komentar | |
|---|---|---|---|---|---|
| aktualna | 20:14, 10 decembar 2014 | | 652 × 415 (7 kB) | GifTagger | Bot: Converting file to superior PNG file. (Source: Demographic_change_in_Sweden_1735-2000.gif). This GIF was problematic due to non-greyscale color table. |
Upotreba datoteke
Sljedeća stranica koristi ovu datoteku:
Globalna upotreba datoteke
Ovu datoteku upotrebljavaju i sljedeći projekti:
- Upotreba na projektu bg.wikipedia.org
- Upotreba na projektu bn.wikipedia.org
- Upotreba na projektu cs.wikipedia.org
- Upotreba na projektu da.wikipedia.org
- Upotreba na projektu da.wikibooks.org
- Upotreba na projektu en.wikipedia.org
- Upotreba na projektu es.wikipedia.org
- Upotreba na projektu fi.wikipedia.org
- Upotreba na projektu fr.wikipedia.org
- Upotreba na projektu hy.wikipedia.org
- Upotreba na projektu ja.wikipedia.org
- Upotreba na projektu ru.wikipedia.org
- Upotreba na projektu sr.wikipedia.org
- Upotreba na projektu sv.wikipedia.org
- Upotreba na projektu uk.wikipedia.org